A distribution center built its receiving labor plan about a week ahead from projected volume and associate availability, with no visibility into per-trailer complexity or day-of conditions. The pilot's go/no-go target calls for 35% of shifts to run on a complexity-scored sequence by Day 60, up from 10% by Day 30.
Not enough staff. A receiving team cannot judge, shift to shift, which of dozens of inbound trailers will carry VAS work, re-ticketing, or security tagging until the trailer is already on the floor. A labor plan built from a week-old volume forecast is locked in before anyone knows which trailers will be the hard ones.
Disconnected systems. The signals that predict a hard trailer already exist — timestamps and activity codes in the WMS, associate productivity in the LMS, arrival and detention timers in the TMS/YMS, VAS and priority flags on the ASN/PO/BOL — but they sit in five separate systems that nobody combines before the trailer reaches the dock.
10% → 35%
Trailer Prioritization Compliance target (Day 30 → Day 60)
>1%
Receiving UPH improvement targeted on a specific shift
CPU ↓
Cost-per-unit reduction targeted vs. baseline
Find it
Our forward-deployed engineers connect the systems you already run and turn scattered data into one view. Agents then cut thousands of signals down to the few that matter.
Prove it
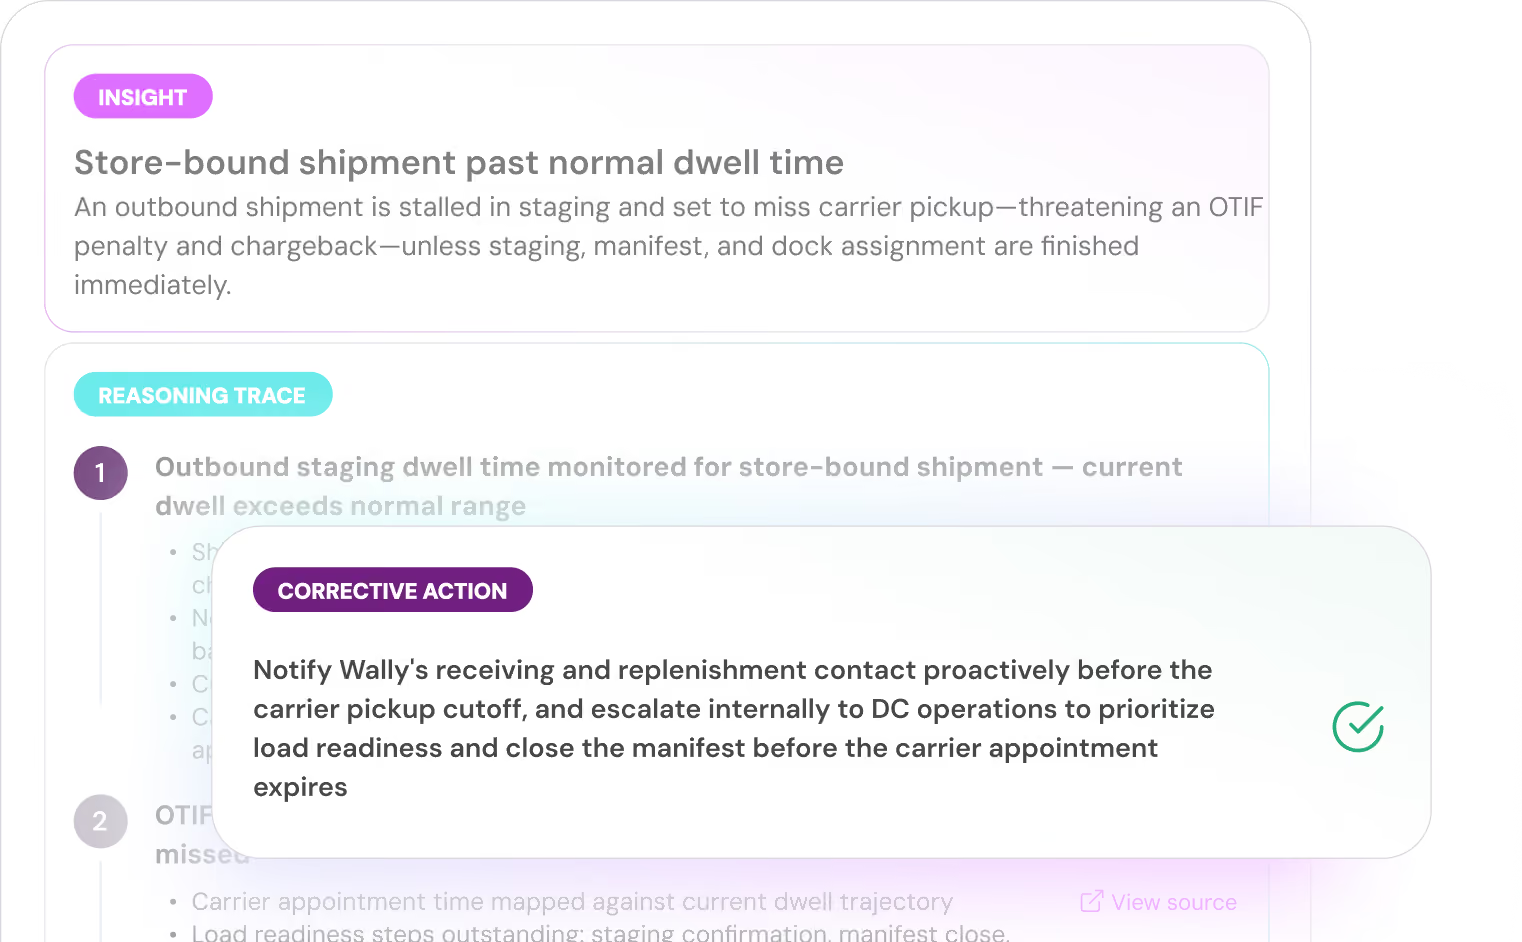
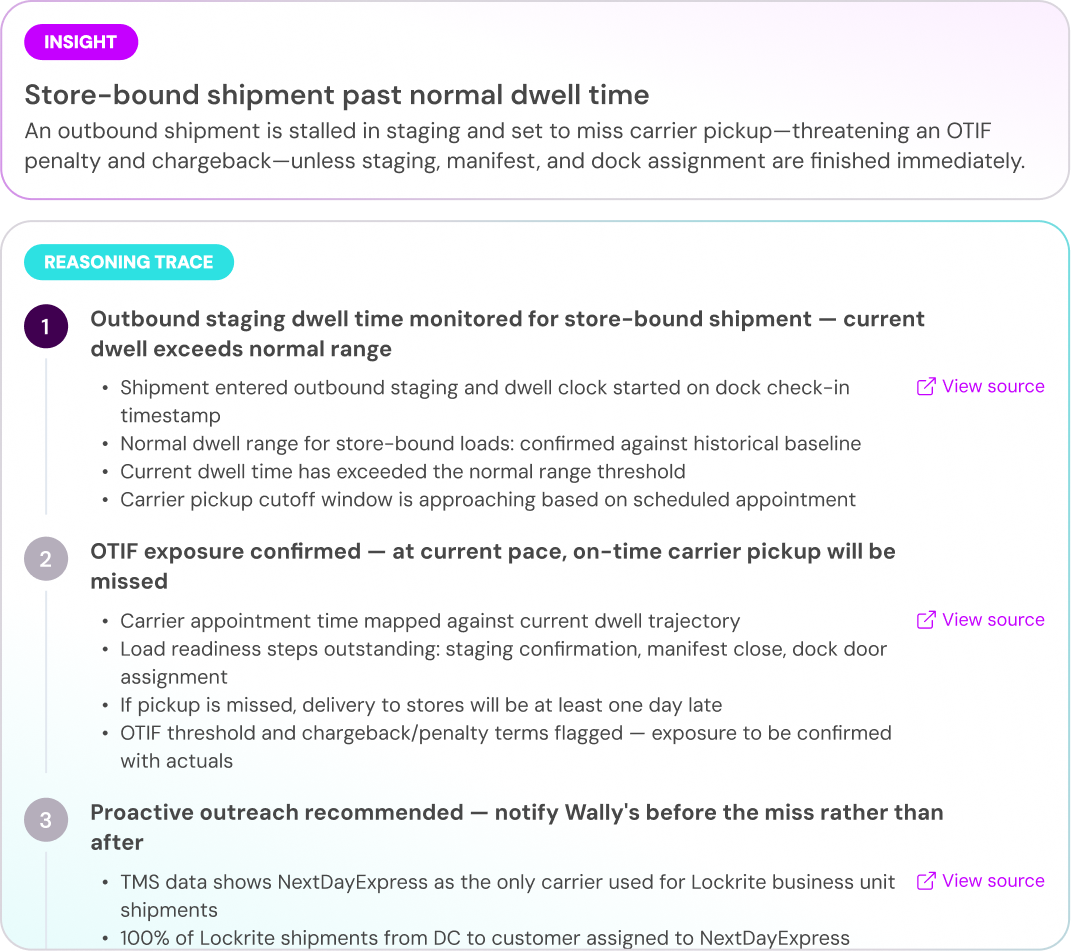
The agent assembles evidence for one failure across systems that never agree, puts a dollar value on it, and shows its reasoning with linked sources.
Fix it
A finding isn't a fix. The agent takes corrective action, and our engineers build it into your existing tools, so the solution is autonomous instead of arriving as another report.
01 Find it
In receiving, trailers differ widely in workload, yet the labor plan treated them alike. A floor-loaded trailer needing re-ticketing and security tagging can take several times the dock-to-stock labor of a clean palletized load, yet both were planned from the same volume forecast built a week earlier. The complexity was knowable in advance; no one had scored it.
Beamup assigns every inbound trailer a composite Trailer Complexity Score (0–100) and maps it to a difficulty tier, drawing on systems the DC already runs — no new hardware:
- WMS – receiving timestamps, putaway logs, activity codes, dock-to-stock timing
- LMS – associate productivity by shift and activity, skill classification
- TMS/YMS – trailer arrival, dock assignment, detention timers
- ASN/PO/BOL – advance ship notices, VAS flags, buyer priority
- Labor plan – planned headcount by shift, activity, and skill
The score weights VAS density, vendor history, load type and volume, and buyer urgency, with final weights tuned against historical processing times.
A Beamup forward-deployed engineer embeds with the customer's operations and data teams during the first weeks to map these sources to the facility's actual scan behavior, calibrate the complexity score against historical dock-to-stock times, and set tier thresholds with operations leadership. This onboarding is what tunes the scoring to this building and lets the program run on data the DC already produces, with no hardware project.
02 Prove it
A faster shift proves nothing on its own — it may simply have drawn an easier trailer mix. Beamup compares like with like: a Beamup-sequenced shift against a manually planned shift, only within the same difficulty tier and activity type, and a test/control trailer pair counts only when the two complexity scores fall within ±15% of each other.
Five control variables keep the comparison honest — difficulty tier, associate proficiency, employment type, productive-activity mix, and day-of-week/volume — and the share of excluded hours is reported for transparency.
Every targeted gain is isolated to same-tier, same-activity shifts within a 15% complexity match, so a result reads as the sequence's doing — not a lighter trailer mix that day.


03 Fix it
A ranked sequence the team acts on, every cycle. Every 30–60 minutes during active receiving, Beamup ranks the trailers for the next window by zone, giving each trailer's difficulty tier, priority score, estimated processing time by stage, and the labor profile it needs. In the pilot, that sequence feeds dock scheduling through a spreadsheet; the next phase replaces the spreadsheet with a direct data feed.
Flag VAS-heavy trailers
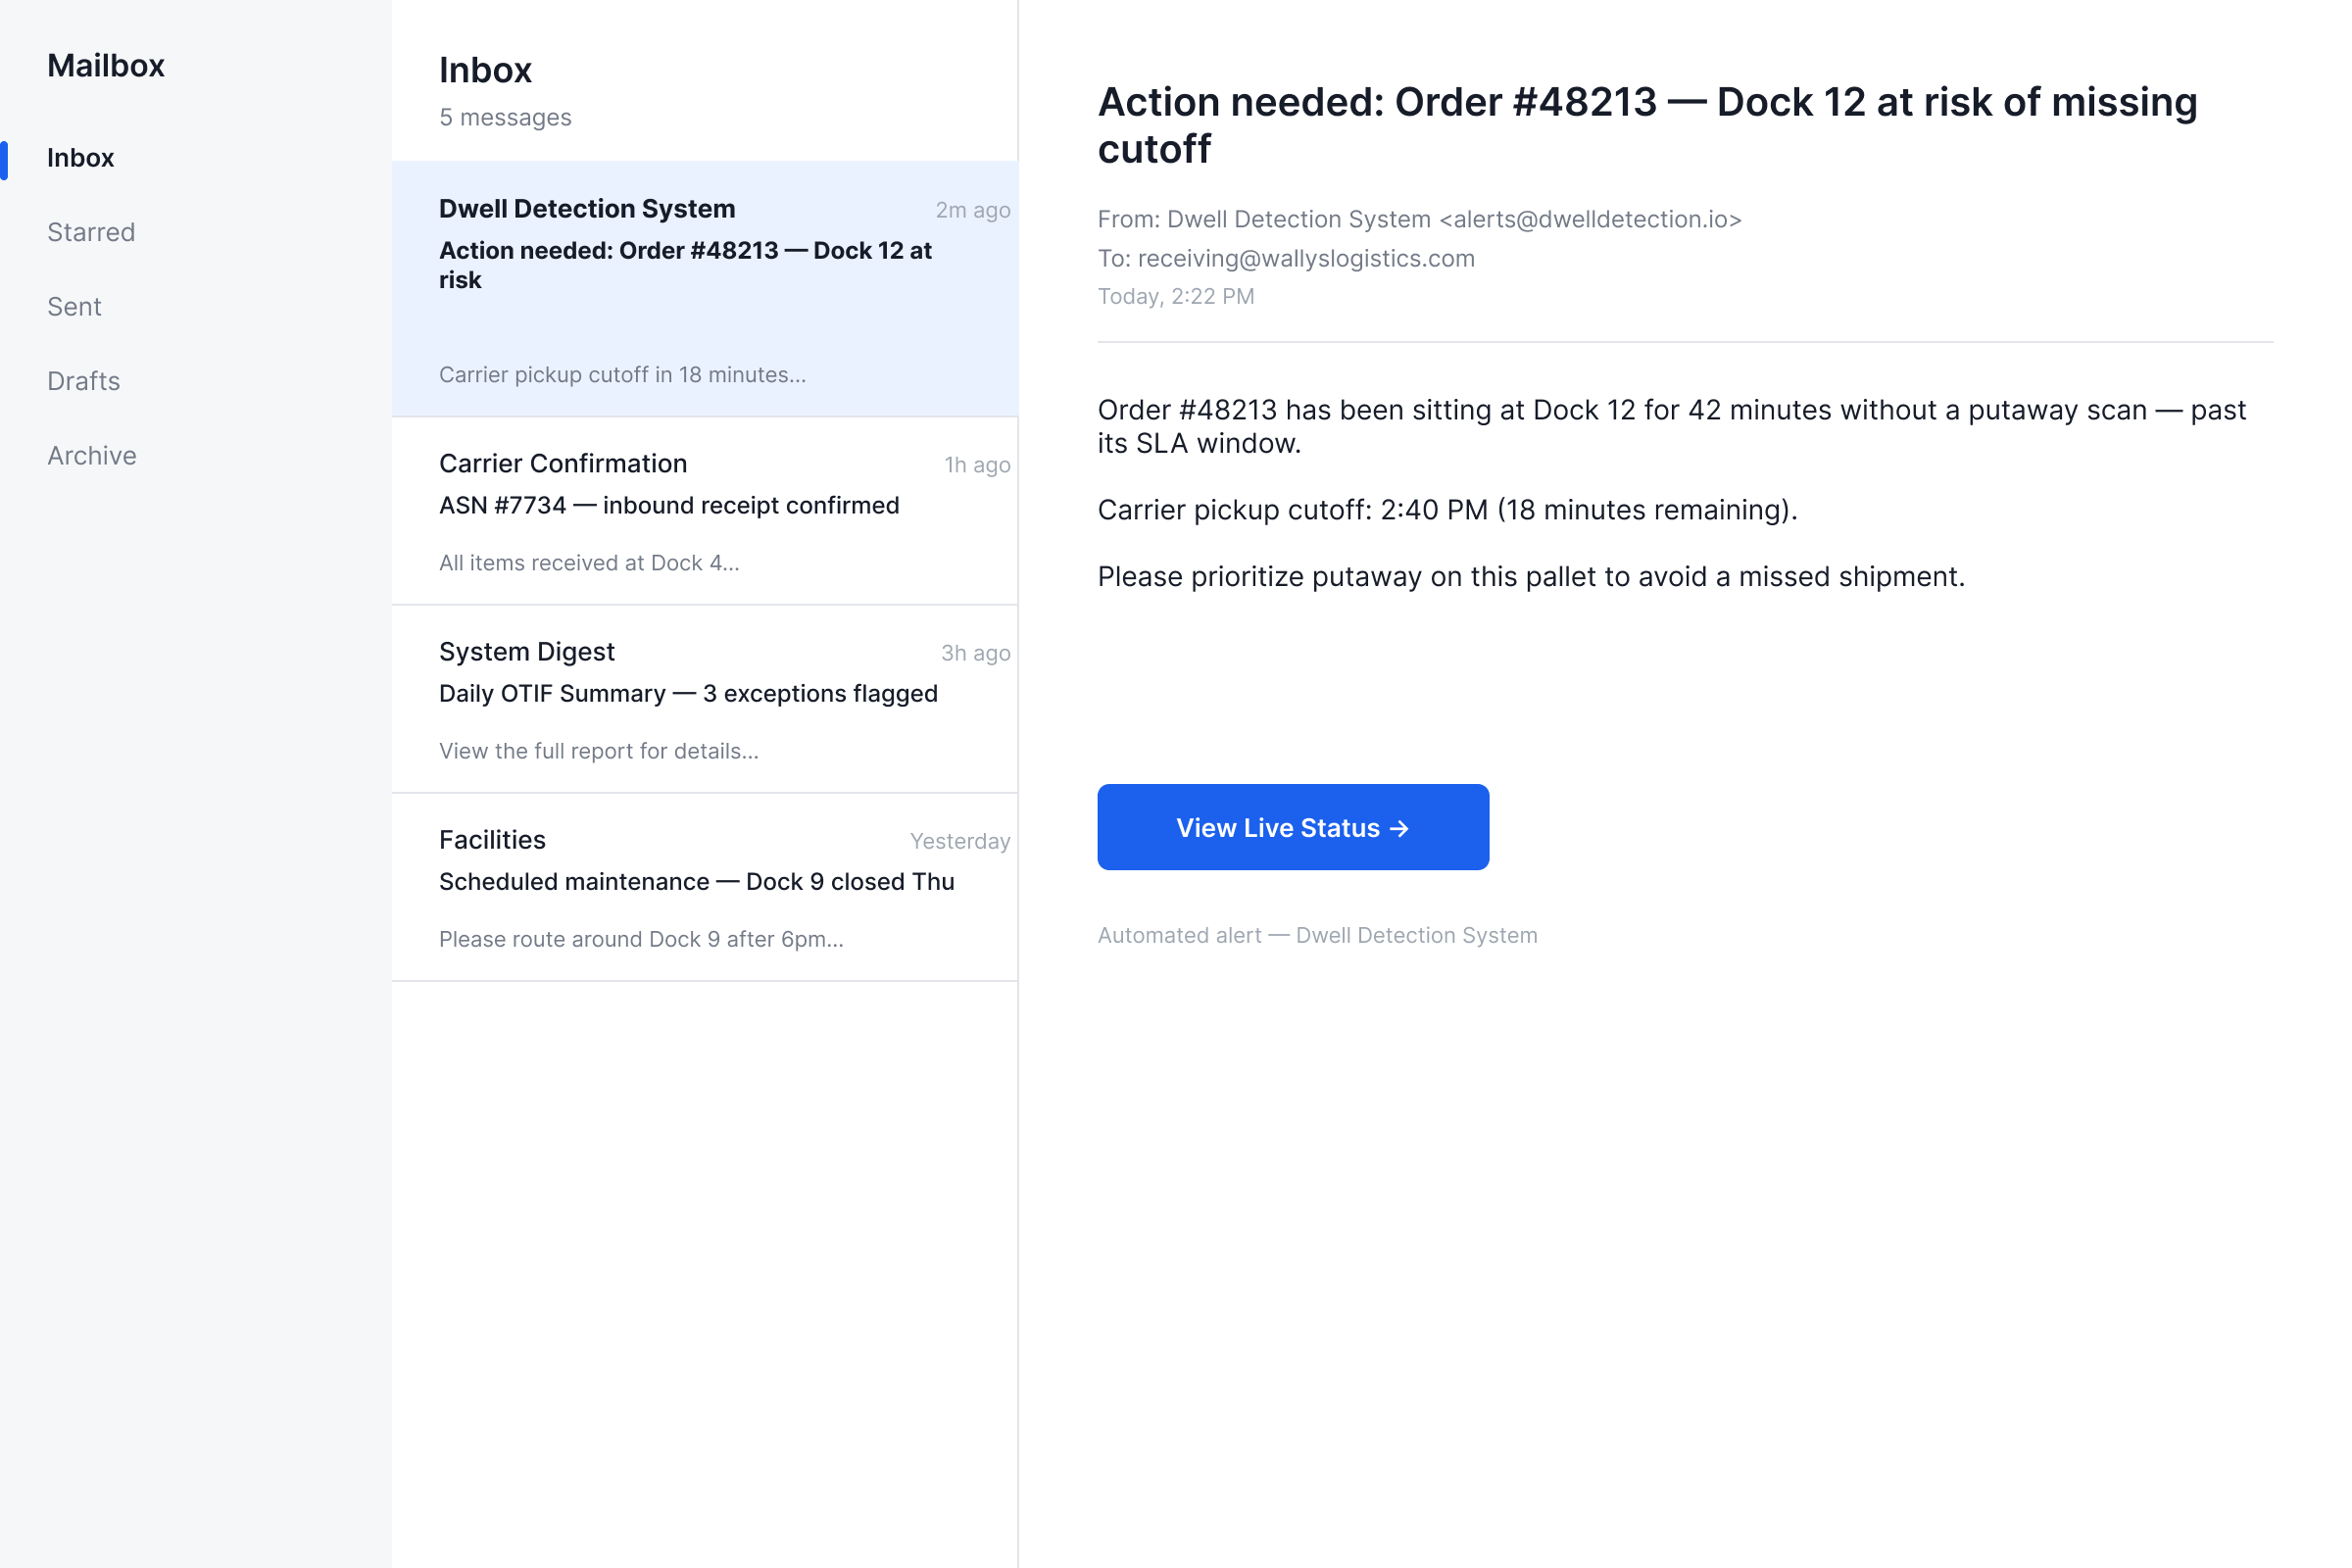
Confirm trailer accessibility in the yard
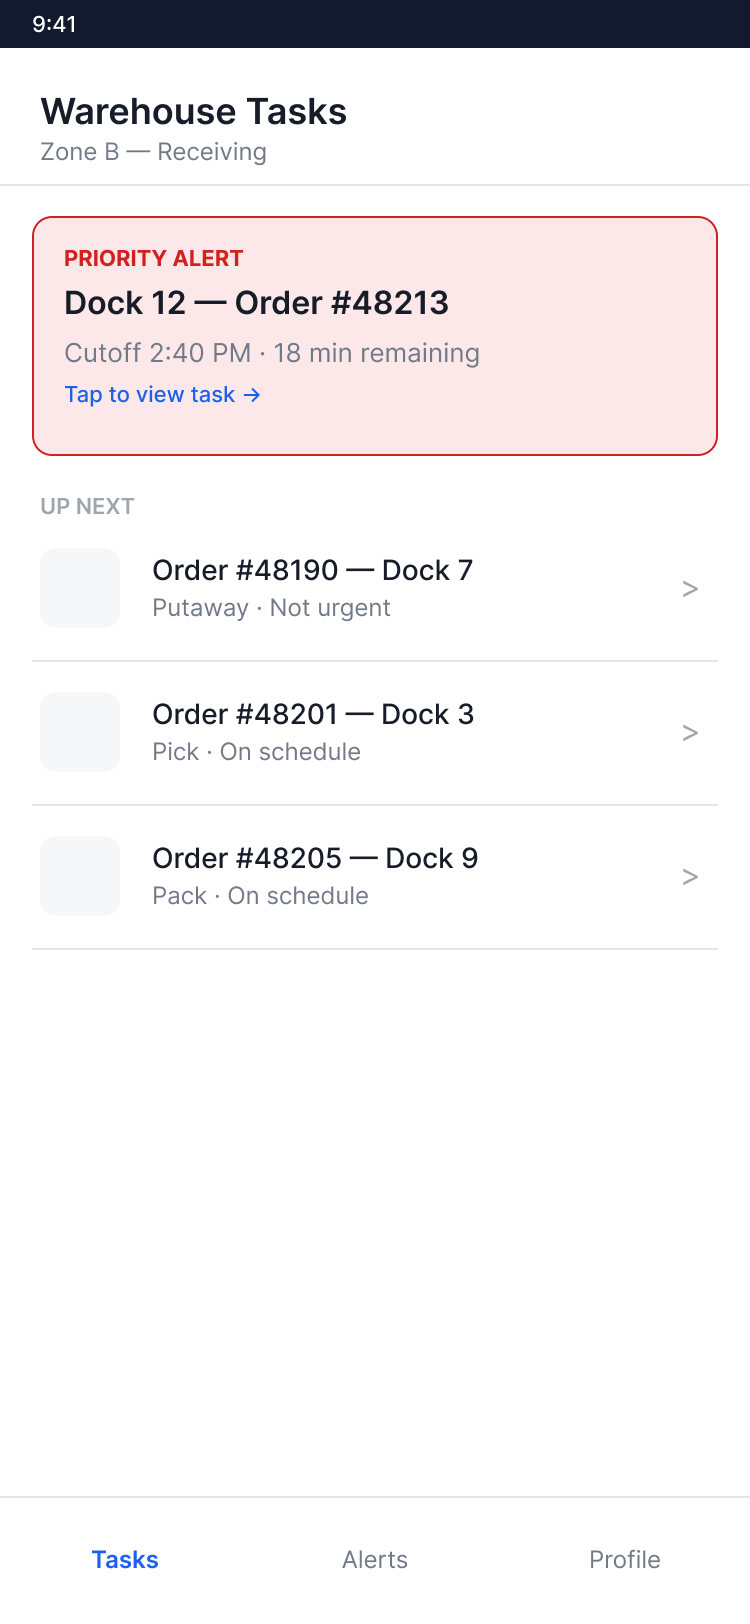
Feed sequence into dock scheduling
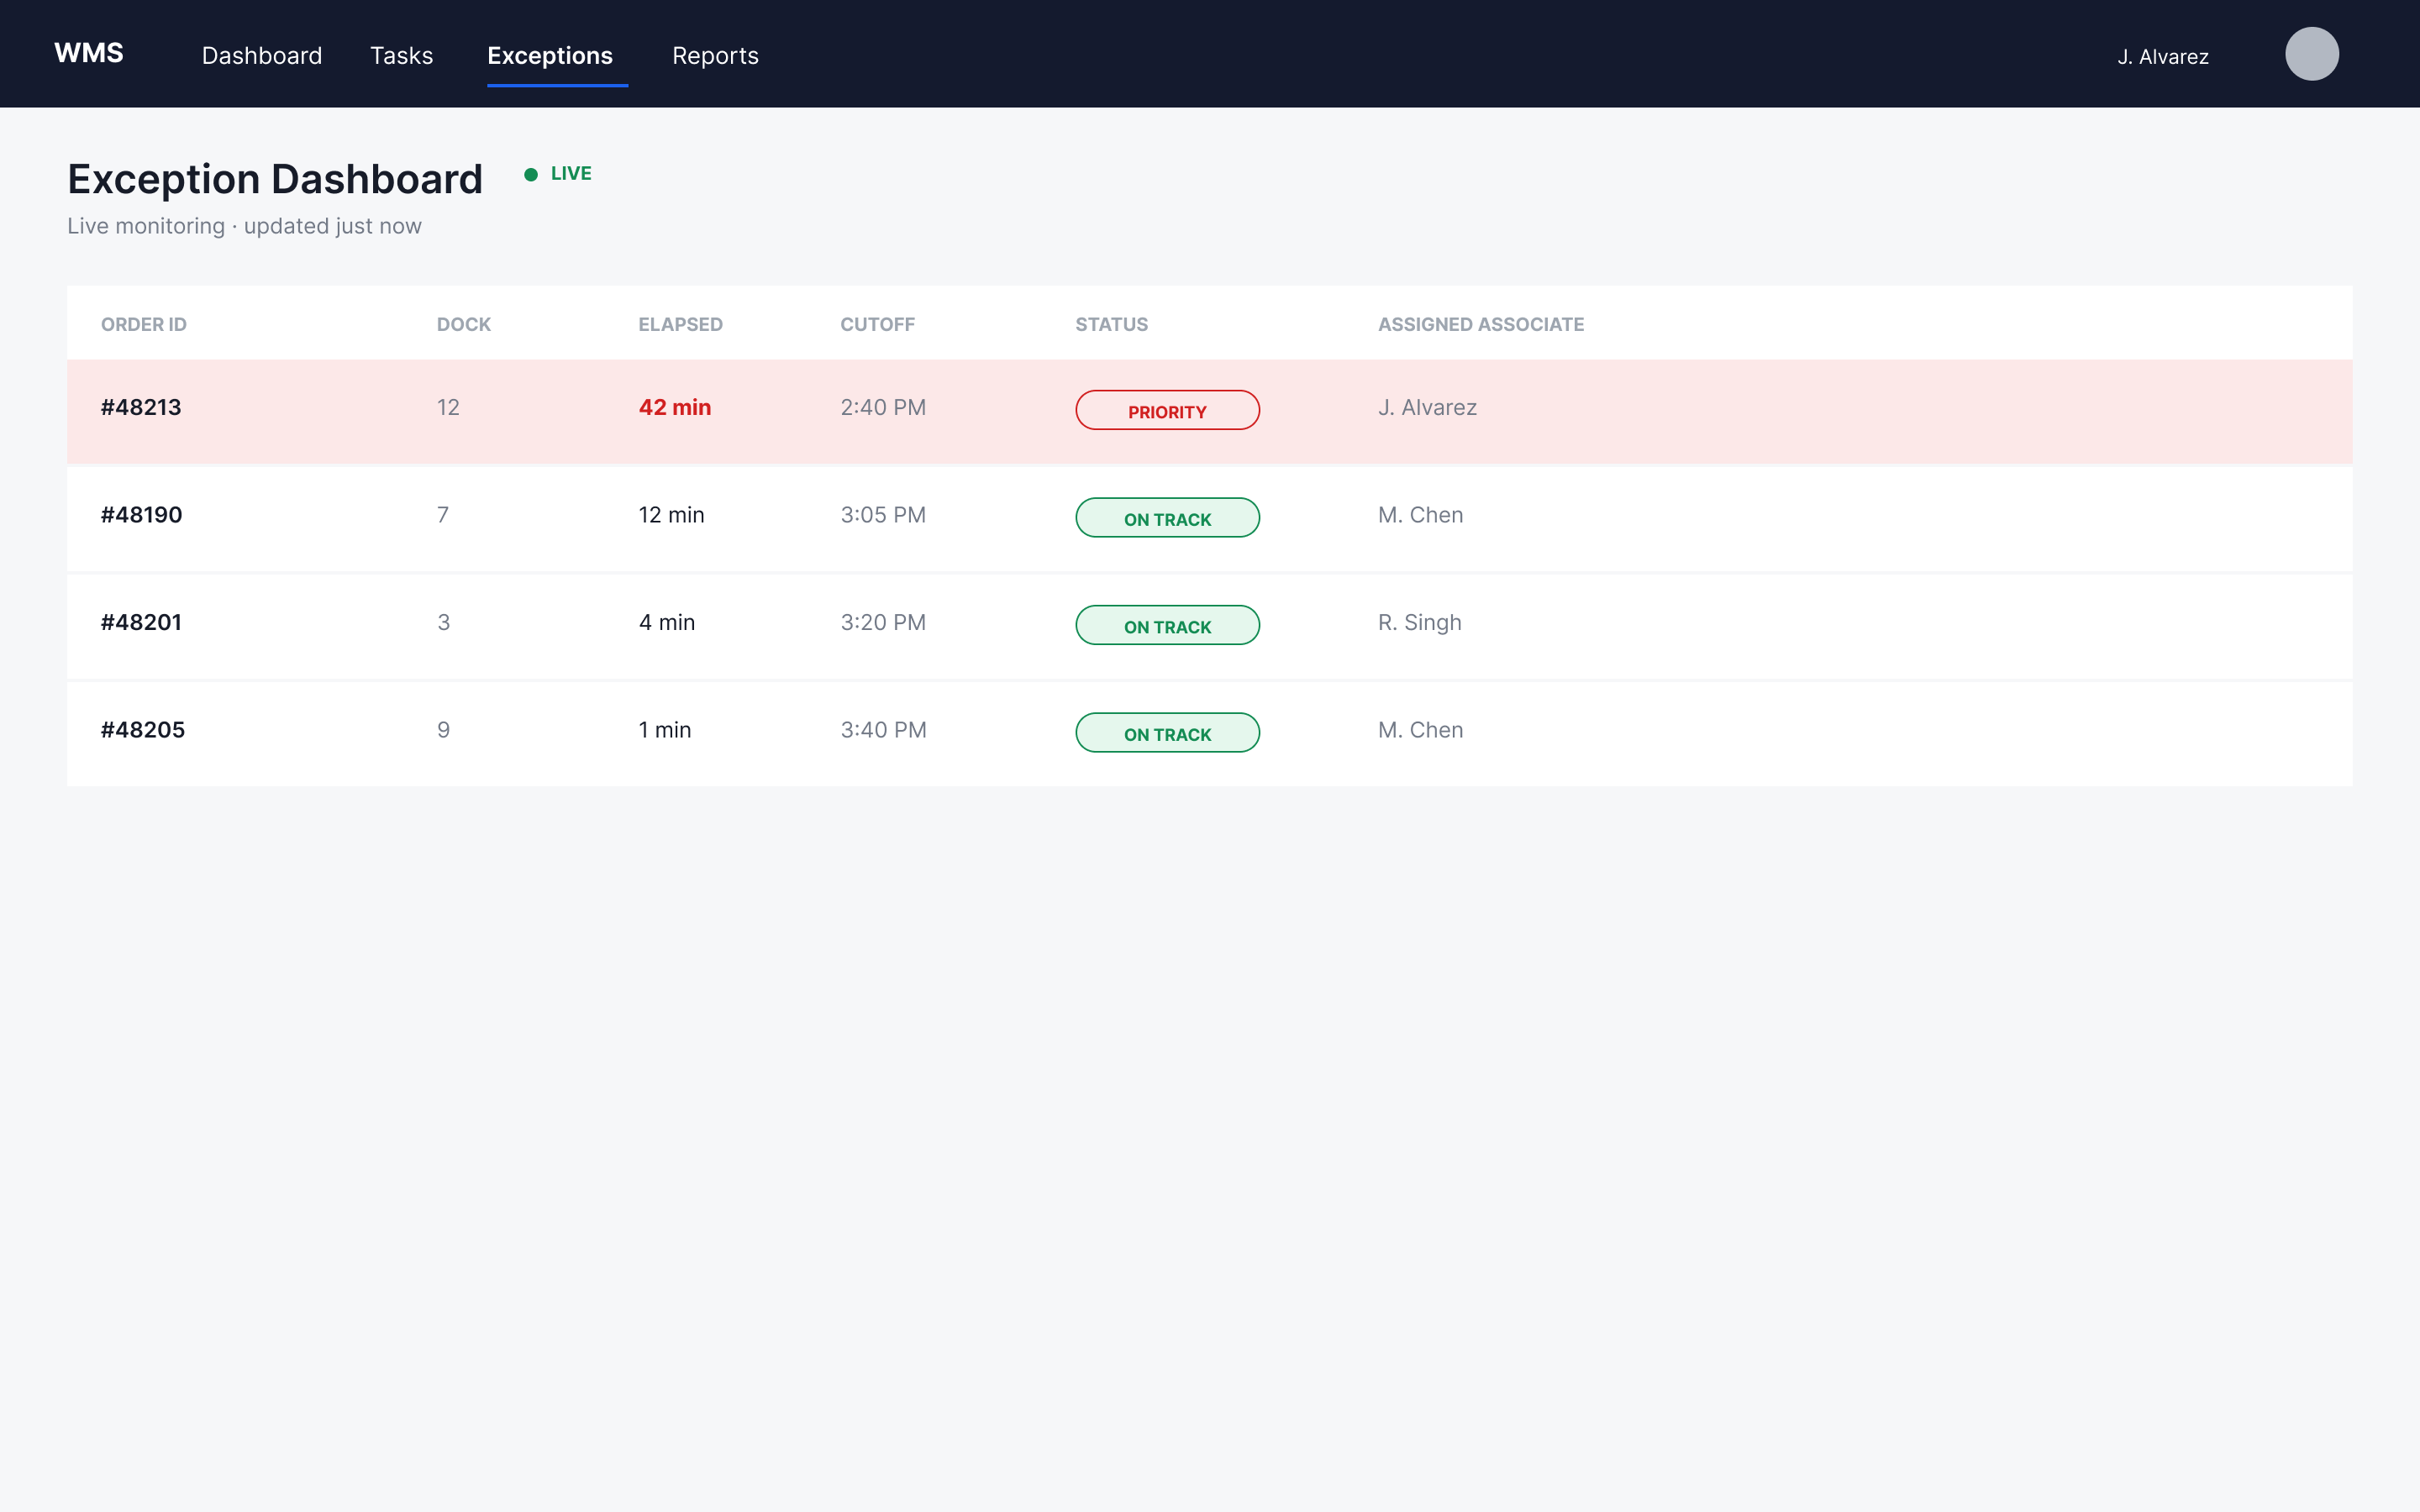
The Bottom Line
Receiving labor used to be planned from a forecast that could not see what was on the trailers. Beamup reads the data the DC already produces to score each trailer's complexity before it reaches the dock, and the plan is then matched to the actual workload. A forward-deployed Beamup engineer connects the facility's own WMS, LMS, TMS/YMS, and ASN data into one complexity model, calibrates it to how the building runs, and delivers a ranked unload sequence every cycle. The like-for-like measurement method traces every targeted gain back to that sequence, and the 90-day pilot's go/no-go targets determine continuation to the subscription term.

Labor Productivity Monitoring
The same WMS foundation surfaces subpar performance, suchas UPH gaps and putaway or pick errors, and ranks each root cause by labor impact.
Outbound & Fulfillment
Extend complexity scoring and sequencing from receiving to pick, sort, and pack, where order mix and cutoff pressure drive the same labor-matching problem.
Multi-Site Rollout
The scoring model scales to additional distribution centers through calibration, without a rebuild. Each site is tuned to its own vendor and volume profile.